CI/CD for JavaScript Developers in 2026 and Why Your Deployment Pipeline Is the Skill Gap Costing You Senior Roles
📧 Subscribe to JavaScript Insights
Get the latest JavaScript tutorials, career tips, and industry insights delivered to your inbox weekly.
67% of senior JavaScript developer job postings on major platforms now list CI/CD experience as a requirement. Not a nice-to-have. A requirement. Two years ago that number was closer to 40%. The shift happened quietly while most frontend developers were focused on frameworks and state management.
I track hiring trends daily running jsgurujobs.com, and the pattern is unmistakable. Companies that used to hire separate DevOps engineers for deployment pipelines are now expecting their senior JavaScript developers to own the entire delivery process. Write the code, write the tests, configure the pipeline, ship it to production, monitor it after deployment. One person. End to end.
CI/CD stands for Continuous Integration and Continuous Deployment. But knowing the definition is not what gets you hired. What gets you hired is being the developer who can look at a pull request, understand that it will break the staging environment because the database migration runs before the new API endpoint is deployed, and fix the pipeline before anyone else notices.
This is not a DevOps article. This is a JavaScript developer's guide to the deployment pipelines you will be expected to understand, configure, and debug in 2026. The tools, the patterns, the mistakes that break production, and the interview questions that separate mid-level from senior.
Why CI/CD Became a Core JavaScript Developer Skill in 2026
The economics changed. A mid-size SaaS company in 2023 had a team of 8 engineers with a dedicated DevOps person handling deployments. That same company in 2026 has 4 engineers and no dedicated DevOps. The infrastructure moved to managed services. The pipelines moved to YAML files in the repository. And the responsibility moved to every developer on the team.
AI accelerated this compression. When an AI coding assistant can generate a React component in 30 seconds, the bottleneck is no longer writing code. The bottleneck is shipping code safely. Companies realized that developers who can only write code but cannot deploy it are half as valuable as developers who can do both.
The salary data confirms this. JavaScript developers with CI/CD skills on their resume earn 15-25% more than those without, according to multiple salary surveys from late 2025. That gap is widening in 2026 because the supply of JavaScript developers who actually understand deployment pipelines is much smaller than the demand. Plenty of developers have used CI/CD. Very few understand it well enough to design and debug it.
If you have been treating CI/CD as someone else's problem, 2026 is the year that changes. Not because I am telling you to learn it, but because the job market is telling you.
Continuous Integration Explained for JavaScript Developers Who Have Never Configured a Pipeline
Continuous Integration means every code change triggers an automated process that validates the change before it reaches the main branch. In practical terms, you push code, and a server somewhere runs your tests, checks your types, lints your code, builds the project, and tells you if anything is broken.
The "continuous" part is important. This does not mean running tests once before a release. It means every single commit, every single pull request, every single time. The goal is to catch problems within minutes of introducing them, not days later when the context has left your brain.
For a typical JavaScript project, a CI pipeline does something like this. It checks out your code from the repository. It installs dependencies. It runs ESLint to catch code quality issues. It runs TypeScript compilation to catch type errors. It runs your unit tests with Jest or Vitest. It runs your integration tests. It builds the production bundle. And if all of that passes, it marks the commit as green.
The entire process should take less than 5 minutes for most JavaScript projects. If your CI pipeline takes 15 minutes, developers stop waiting for it and merge anyway. Speed matters because CI only works if developers actually pay attention to it.
Setting Up GitHub Actions for a JavaScript Project
GitHub Actions is the most common CI/CD platform for JavaScript projects in 2026. Over 80% of open source JavaScript projects use it, and most companies have adopted it for private repositories as well. The configuration lives in .github/workflows/ as YAML files.
Here is a production-realistic CI workflow for a Next.js application with TypeScript:
name: CI

on:
  push:
    branches: [main]
  pull_request:
    branches: [main]

concurrency:
  group: ci-${{ github.ref }}
  cancel-in-progress: true

jobs:
  validate:
    runs-on: ubuntu-latest
    strategy:
      matrix:
        node-version: [20, 22]

    steps:
      - uses: actions/checkout@v4

      - name: Setup Node.js ${{ matrix.node-version }}
        uses: actions/setup-node@v4
        with:
          node-version: ${{ matrix.node-version }}
          cache: 'npm'

      - name: Install dependencies
        run: npm ci

      - name: Lint
        run: npm run lint

      - name: Type check
        run: npx tsc --noEmit

      - name: Unit tests
        run: npm test -- --coverage

      - name: Build
        run: npm run build

      - name: Upload coverage
        if: matrix.node-version == 22
        uses: actions/upload-artifact@v4
        with:
          name: coverage
          path: coverage/
A few things to notice. The concurrency block cancels in-progress runs when you push a new commit to the same branch. Without this, pushing three quick fixes creates three parallel pipeline runs and wastes your CI minutes. The npm ci command is not npm install. It installs exact versions from the lockfile, which makes builds reproducible and faster. The matrix strategy runs tests on both Node 20 and 22, which catches compatibility issues early.
Caching Dependencies to Cut Pipeline Time in Half
The slowest part of most JavaScript CI pipelines is installing dependencies. A medium project with 500 packages can spend 45-90 seconds on npm ci. Caching fixes this.
GitHub Actions has built-in caching through actions/setup-node with the cache option. But for more control, you can use explicit caching:
- name: Cache node_modules
  id: cache-deps
  uses: actions/cache@v4
  with:
    path: node_modules
    key: deps-${{ runner.os }}-${{ hashFiles('package-lock.json') }}

- name: Install dependencies
  if: steps.cache-deps.outputs.cache-hit != 'true'
  run: npm ci
This approach skips npm ci entirely when the lockfile has not changed. On a typical project, this saves 60-90 seconds per pipeline run. Multiply that by 50 pull requests per week and you are saving hours of CI time monthly.
For monorepos using Turborepo or Nx, remote caching becomes even more important. Turborepo's remote cache means that if one developer already built a package with the same inputs, every other developer and CI run skips that build entirely. I have seen monorepo CI times drop from 12 minutes to 3 minutes with proper remote caching configured.
Continuous Deployment Pipelines and How JavaScript Applications Actually Reach Production
Continuous Deployment is where CI ends and delivery begins. Your code passed all checks. Now it needs to reach actual users. This is where most JavaScript developers feel lost because deployment involves infrastructure concepts that were traditionally someone else's job.
The simplest deployment pipeline for a JavaScript application in 2026 looks like this: code merges to main, CI runs, if green then deploy to staging, run smoke tests against staging, if green then deploy to production. That is the basic flow. Everything else is optimization and safety layers on top.
Deploying a Next.js Application with GitHub Actions and Vercel
Vercel is the most common deployment target for Next.js applications, but the principles apply to any platform. Here is what a deployment workflow looks like:
name: Deploy

on:
  push:
    branches: [main]

jobs:
  deploy-staging:
    runs-on: ubuntu-latest
    environment: staging
    steps:
      - uses: actions/checkout@v4

      - name: Setup Node.js
        uses: actions/setup-node@v4
        with:
          node-version: 22
          cache: 'npm'

      - name: Install dependencies
        run: npm ci

      - name: Run tests
        run: npm test

      - name: Build
        run: npm run build

      - name: Deploy to staging
        run: npx vercel --prod --token=${{ secrets.VERCEL_TOKEN }}
        env:
          VERCEL_ORG_ID: ${{ secrets.VERCEL_ORG_ID }}
          VERCEL_PROJECT_ID: ${{ secrets.VERCEL_PROJECT_ID }}

  deploy-production:
    needs: deploy-staging
    runs-on: ubuntu-latest
    environment:
      name: production
      url: https://yourapp.com
    steps:
      - name: Deploy to production
        run: npx vercel --prod --token=${{ secrets.VERCEL_TOKEN }}
        env:
          VERCEL_ORG_ID: ${{ secrets.VERCEL_ORG_ID }}
          VERCEL_PROJECT_ID: ${{ secrets.VERCEL_PROJECT_ID }}
The environment keyword is important. GitHub environments allow you to set up protection rules like requiring manual approval before production deployment. This means the staging deploy happens automatically, but production requires someone to click "Approve" in the GitHub UI. For small teams, this manual gate is often the right balance between speed and safety.
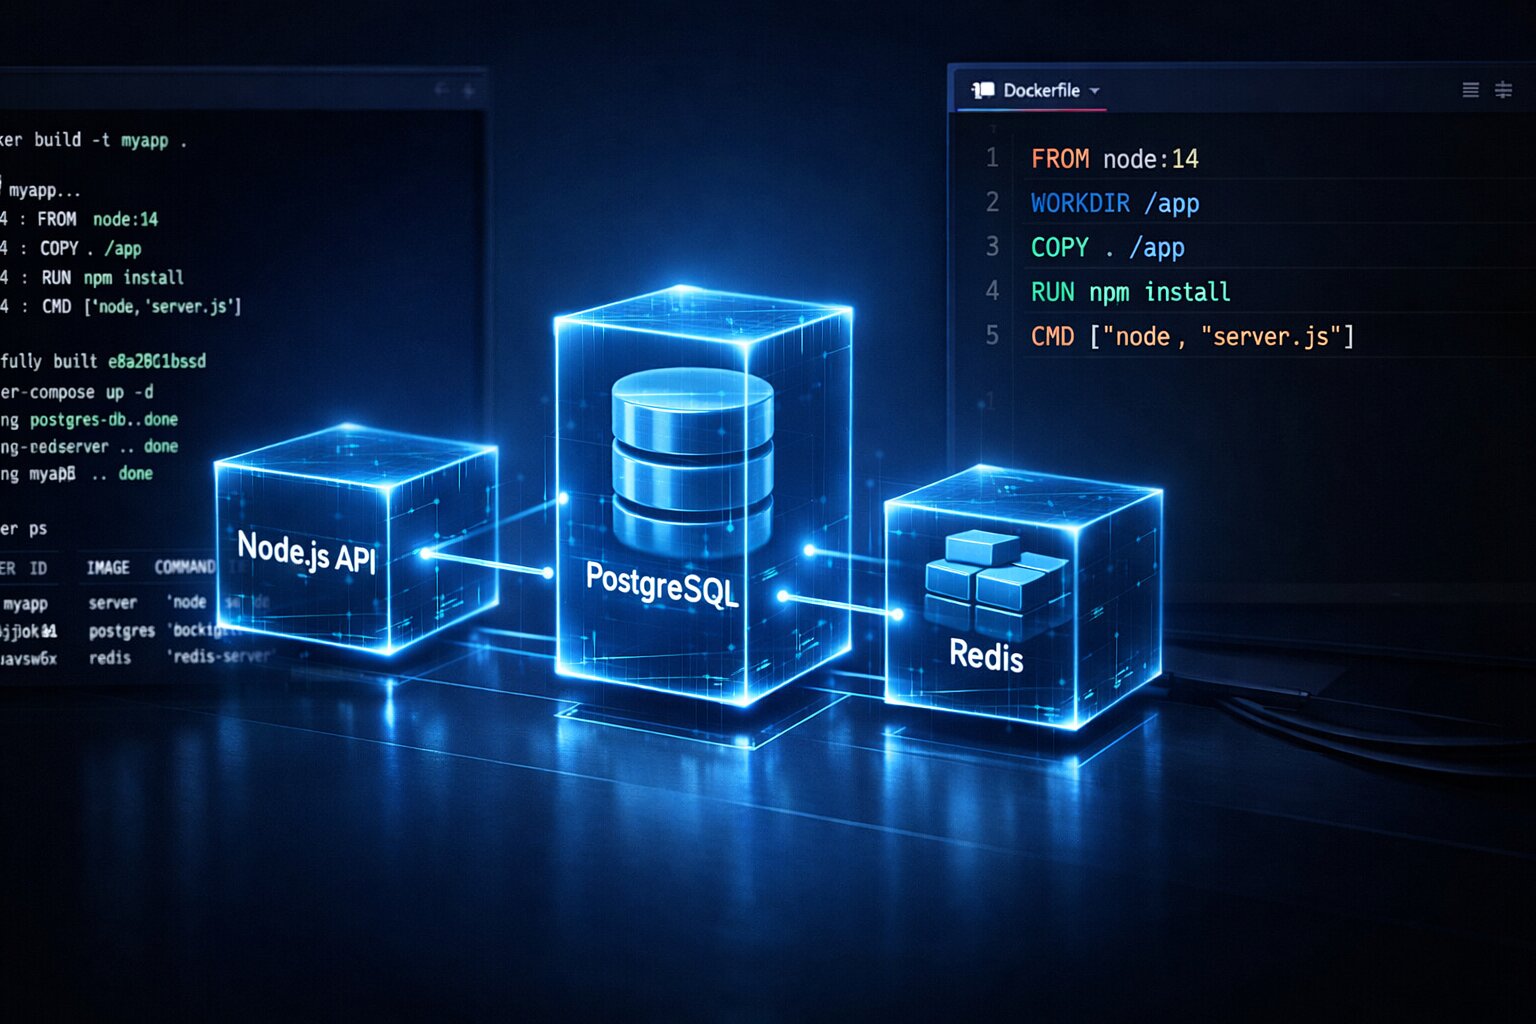
Docker-Based Deployments for Node.js Backend Services
Not every JavaScript application deploys to Vercel. Backend Node.js services, API servers, and microservices typically deploy as Docker containers to platforms like AWS ECS, Google Cloud Run, or Kubernetes clusters. Understanding Docker as a JavaScript developer is now a baseline expectation.
Here is a production Dockerfile for a Node.js API:
FROM node:22-alpine AS builder

WORKDIR /app
COPY package*.json ./
RUN npm ci --only=production
COPY . .
RUN npm run build

FROM node:22-alpine AS runner

WORKDIR /app
RUN addgroup -g 1001 -S nodejs && adduser -S nextjs -u 1001

COPY --from=builder --chown=nextjs:nodejs /app/dist ./dist
COPY --from=builder --chown=nextjs:nodejs /app/node_modules ./node_modules
COPY --from=builder --chown=nextjs:nodejs /app/package.json ./

USER nextjs
EXPOSE 3000
ENV NODE_ENV=production

CMD ["node", "dist/server.js"]
The multi-stage build is not optional. Your builder stage has all devDependencies for compilation. Your runner stage has only production dependencies and compiled code. This reduces image size from 800MB+ to under 200MB, which means faster deployments and lower costs.
The CI pipeline for Docker deployments adds a build-and-push step:
- name: Build and push Docker image
  uses: docker/build-push-action@v5
  with:
    context: .
    push: true
    tags: |
      your-registry.com/api:${{ github.sha }}
      your-registry.com/api:latest
    cache-from: type=gha
    cache-to: type=gha,mode=max
Tagging with github.sha gives you an exact mapping between every commit and its deployed image. When production breaks at 3am, you can immediately identify which commit is running and which commit was running before.
Testing Strategies Inside CI/CD Pipelines That Actually Catch Bugs Before Production
Running tests in CI is not the same as running tests locally. Locally, you have a database running, environment variables set, maybe some services mocked. CI is a blank server that knows nothing about your project. The gap between local tests passing and CI tests failing is where most JavaScript developers lose hours.
The most common CI test failure I see is environment-dependent tests. A test that passes because it relies on a locally running PostgreSQL instance. A test that assumes a specific timezone. A test that hits a third-party API that rate-limits CI servers. All of these work on your machine and fail spectacularly in the pipeline.
Structuring Test Stages for Maximum CI Pipeline Efficiency
The order of your test stages matters more than most developers realize. Here is the optimal order for a JavaScript CI pipeline:
steps:
  - name: Lint and type check
    run: |
      npm run lint
      npx tsc --noEmit

  - name: Unit tests
    run: npm test -- --coverage --bail

  - name: Integration tests
    run: npm run test:integration

  - name: E2E tests
    run: npx playwright test
Lint and type check run first because they are the fastest and catch the most obvious problems. If you have a TypeScript error, there is no point running 500 unit tests. The --bail flag on unit tests stops at the first failure instead of running all tests and showing 47 failures. Integration tests run after unit tests because they are slower and depend on more infrastructure. E2E tests with Playwright run last because they are the slowest and most resource-intensive.
This ordering means that a simple typo gets caught in 15 seconds instead of waiting 4 minutes for the full pipeline to fail. Fast feedback loops keep developers productive.
For teams serious about JavaScript testing in production environments, the CI pipeline should also generate and store test coverage reports. Coverage thresholds in CI prevent the slow erosion of test quality that happens in every project over time.
Running Database-Dependent Tests in CI with Service Containers
Many JavaScript applications need a database for integration tests. GitHub Actions provides service containers that spin up databases alongside your test runner:
jobs:
  integration-tests:
    runs-on: ubuntu-latest
    services:
      postgres:
        image: postgres:16
        env:
          POSTGRES_USER: test
          POSTGRES_PASSWORD: test
          POSTGRES_DB: testdb
        ports:
          - 5432:5432
        options: >-
          --health-cmd pg_isready
          --health-interval 10s
          --health-timeout 5s
          --health-retries 5

      redis:
        image: redis:7
        ports:
          - 6379:6379

    steps:
      - uses: actions/checkout@v4

      - name: Run integration tests
        run: npm run test:integration
        env:
          DATABASE_URL: postgresql://test:test@localhost:5432/testdb
          REDIS_URL: redis://localhost:6379
The health-cmd option is easy to miss and important to include. Without it, your tests might start before PostgreSQL is ready to accept connections, causing random failures that work on retry. Health checks ensure the database is actually ready before tests begin.
Environment Variables and Secrets Management in JavaScript CI/CD
Hardcoding API keys in code is an obvious mistake. But the way most JavaScript developers handle environment variables in CI/CD is only slightly better. Storing secrets in GitHub Secrets and referencing them in workflows is the minimum. Production-grade secret management goes further.
The common pattern looks like this:
env:
  DATABASE_URL: ${{ secrets.DATABASE_URL }}
  STRIPE_SECRET_KEY: ${{ secrets.STRIPE_SECRET_KEY }}
  SENDGRID_API_KEY: ${{ secrets.SENDGRID_API_KEY }}
This works, but it creates a problem. Every developer who needs to update a secret must have admin access to the repository. Secrets are not versioned. You cannot see what changed when a deployment breaks because someone updated an environment variable.
Managing Environment-Specific Configuration Across Staging and Production
A better approach separates configuration by environment using GitHub environments:
jobs:
  deploy-staging:
    environment: staging
    steps:
      - name: Deploy
        env:
          DATABASE_URL: ${{ secrets.DATABASE_URL }}
          API_URL: https://api-staging.yourapp.com

  deploy-production:
    environment: production
    steps:
      - name: Deploy
        env:
          DATABASE_URL: ${{ secrets.DATABASE_URL }}
          API_URL: https://api.yourapp.com
Each environment has its own set of secrets. The staging DATABASE_URL points to the staging database, and the production DATABASE_URL points to the production database. Same variable name, different values per environment. This prevents the classic mistake of running staging code against the production database.
For larger teams, tools like HashiCorp Vault or AWS Secrets Manager add rotation, audit logs, and fine-grained access control. But for most JavaScript teams under 10 people, GitHub environments with required reviewers is the sweet spot between security and complexity.
Client-Side Environment Variables and the Build-Time Trap
Frontend JavaScript applications have a unique environment variable challenge. Variables like NEXT_PUBLIC_API_URL are embedded into the JavaScript bundle at build time, not at runtime. This means the same build cannot be promoted from staging to production if it contains environment-specific values.
The solution is runtime configuration:
// config.ts
export async function getConfig() {
  if (typeof window !== 'undefined') {
    const response = await fetch('/api/config');
    return response.json();
  }

  return {
    apiUrl: process.env.API_URL,
    analyticsId: process.env.ANALYTICS_ID,
  };
}
Or for simpler setups, inject configuration through a script tag that the server renders:
<script>
  window.__CONFIG__ = {
    apiUrl: "{{API_URL}}",
    analyticsId: "{{ANALYTICS_ID}}"
  };
</script>
The server replaces the placeholders at runtime, not build time. This means one build artifact works across all environments. Build once, deploy everywhere. This is a pattern that senior developers understand and junior developers almost never implement.
Deployment Strategies That Prevent Downtime and Reduce Risk
Deploying to production is the scariest part of the pipeline. A bad deployment means real users see errors, real revenue is lost, and real panic ensues. Deployment strategies exist to minimize that risk.
Blue-Green Deployments for Zero-Downtime JavaScript Releases
Blue-green deployment maintains two identical production environments. Blue is the current live version. Green is where you deploy the new version. Once green is verified, you switch traffic from blue to green. If something goes wrong, switch back to blue instantly.
In practice with a Node.js application on AWS, this looks like having two ECS services behind an Application Load Balancer. Deploy to the inactive service, run health checks, then update the load balancer target group to point to the new service.
- name: Deploy to green environment
  run: |
    aws ecs update-service \
      --cluster production \
      --service api-green \
      --task-definition api:${{ steps.task-def.outputs.revision }}

- name: Wait for green to stabilize
  run: |
    aws ecs wait services-stable \
      --cluster production \
      --services api-green

- name: Run smoke tests against green
  run: |
    curl -f https://green.api.yourapp.com/health || exit 1
    npm run test:smoke -- --base-url=https://green.api.yourapp.com

- name: Switch traffic to green
  run: |
    aws elbv2 modify-listener \
      --listener-arn ${{ secrets.ALB_LISTENER_ARN }} \
      --default-actions Type=forward,TargetGroupArn=${{ secrets.GREEN_TG_ARN }}
The smoke test step between deployment and traffic switch is the safety net. If the health check fails, the pipeline stops and traffic never reaches the broken code.
Canary Deployments for Gradual JavaScript Application Rollouts
Canary deployment sends a small percentage of traffic to the new version first. If error rates stay normal, gradually increase to 100%. If errors spike, pull back to 0%.
This is particularly valuable for frontend JavaScript applications where different users have different browser configurations, screen sizes, and usage patterns. A bug that only affects Safari on iOS might not show up in your test suite but will show up when 5% of real traffic hits the new version.
Platforms like Vercel and Cloudflare Workers support canary deployments natively. For custom setups, you configure it at the load balancer level:
- name: Deploy canary (10% traffic)
  run: |
    aws elbv2 modify-rule \
      --rule-arn ${{ secrets.CANARY_RULE_ARN }} \
      --actions '[
        {"Type": "forward", "ForwardConfig": {
          "TargetGroups": [
            {"TargetGroupArn": "${{ secrets.STABLE_TG }}", "Weight": 90},
            {"TargetGroupArn": "${{ secrets.CANARY_TG }}", "Weight": 10}
          ]
        }}
      ]'

- name: Monitor error rates for 10 minutes
  run: node scripts/monitor-canary.js --duration=600 --threshold=0.5

- name: Promote to 100%
  if: success()
  run: |
    aws elbv2 modify-rule \
      --rule-arn ${{ secrets.CANARY_RULE_ARN }} \
      --actions '[
        {"Type": "forward", "ForwardConfig": {
          "TargetGroups": [
            {"TargetGroupArn": "${{ secrets.CANARY_TG }}", "Weight": 100}
          ]
        }}
      ]'
The monitoring script checks error rates, response times, and key business metrics during the canary period. If any metric crosses a threshold, the pipeline automatically rolls back. No human intervention needed at 3am.
Monitoring and Rollback After JavaScript Deployments
Deploying successfully is only half the battle. The other half is knowing whether the deployment actually works for real users. I have seen deployments that passed every test, showed green health checks, and still broke the checkout flow for 20% of users because of a race condition that only appeared under real traffic patterns.
Post-Deployment Health Checks and Automated Rollback
Every production deployment should include automated health verification:
// scripts/post-deploy-check.js
const checks = [
  { name: 'API Health', url: '/api/health', expected: 200 },
  { name: 'Database Connection', url: '/api/health/db', expected: 200 },
  { name: 'Redis Connection', url: '/api/health/redis', expected: 200 },
  { name: 'Homepage Render', url: '/', expected: 200, contains: '<div id="app">' },
];

async function runChecks(baseUrl, retries = 3) {
  for (const check of checks) {
    let lastError;
    for (let attempt = 0; attempt < retries; attempt++) {
      try {
        const response = await fetch(`${baseUrl}${check.url}`);
        if (response.status !== check.expected) {
          throw new Error(`${check.name}: expected ${check.expected}, got ${response.status}`);
        }
        if (check.contains) {
          const body = await response.text();
          if (!body.includes(check.contains)) {
            throw new Error(`${check.name}: missing expected content`);
          }
        }
        console.log(`PASS: ${check.name}`);
        lastError = null;
        break;
      } catch (error) {
        lastError = error;
        await new Promise(resolve => setTimeout(resolve, 2000));
      }
    }
    if (lastError) {
      console.error(`FAIL: ${lastError.message}`);
      process.exit(1);
    }
  }
}

runChecks(process.env.DEPLOY_URL);
When this script exits with code 1, the pipeline triggers a rollback step:
- name: Post-deploy verification
  id: verify
  continue-on-error: true
  run: node scripts/post-deploy-check.js
  env:
    DEPLOY_URL: https://yourapp.com

- name: Rollback on failure
  if: steps.verify.outcome == 'failure'
  run: |
    echo "Deployment verification failed. Rolling back."
    aws ecs update-service \
      --cluster production \
      --service api \
      --task-definition api:${{ steps.previous-version.outputs.revision }}
This pattern ensures that bad deployments automatically revert without human intervention. The developers get notified, but users never see the broken version for more than a few minutes.
Setting Up Deployment Notifications and Observability
After a deployment, the team needs to know what happened. Slack notifications are the minimum:
- name: Notify deployment
  if: always()
  uses: slackapi/slack-github-action@v1
  with:
    payload: |
      {
        "text": "${{ job.status == 'success' && 'Deployed' || 'FAILED' }}: ${{ github.repository }}@${{ github.sha }}",
        "blocks": [
          {
            "type": "section",
            "text": {
              "type": "mrkdwn",
              "text": "*${{ job.status }}*: `${{ github.repository }}` deployed by ${{ github.actor }}\nCommit: ${{ github.event.head_commit.message }}"
            }
          }
        ]
      }
But notifications alone are not enough. You need to see what your application is doing after deployment. Tools like Datadog, Grafana, or even simple CloudWatch dashboards should show request rates, error rates, response times, and memory usage with a clear marker at the deployment timestamp. When a line goes up right after the deployment marker, you know exactly what caused it.
For JavaScript applications specifically, watch for memory leak patterns that only appear under production load. A Node.js service might pass all health checks but slowly consume more memory until it crashes 6 hours after deployment. Your monitoring should catch the upward memory trend early, not after the first OOM kill.
CI/CD Security Practices Every JavaScript Developer Must Know in 2026
Your CI/CD pipeline has more access than any single developer. It has production database credentials, cloud provider keys, deployment permissions, and package registry tokens. A compromised pipeline means a compromised application.
Supply Chain Attacks Through Dependency Updates
The most likely attack vector for a JavaScript application in 2026 is not a direct hack. It is a compromised npm package. A popular library gets hijacked, publishes a malicious version, and your CI pipeline installs it automatically on the next build.
Pin your action versions to exact commit SHAs, not tags:
# BAD - tag can be moved to point to malicious code
- uses: actions/checkout@v4

# GOOD - SHA is immutable
- uses: actions/checkout@b4ffde65f46336ab88eb53be808477a3936bae11
For npm dependencies, use npm audit in your CI pipeline and fail the build on critical vulnerabilities:
- name: Security audit
  run: npm audit --audit-level=critical
Combine this with Dependabot or Renovate to automatically create pull requests for dependency updates. The CI pipeline then tests each update before it merges, catching breaking changes and malicious code before it reaches production.
Protecting Pipeline Secrets from Exposure
GitHub Actions masks secrets in logs automatically, but developers accidentally expose them in other ways. The most common mistake is echoing environment variables for debugging:
# NEVER do this
- run: echo "Database URL is $DATABASE_URL"

# Also dangerous - env dump
- run: env | sort
Use OpenID Connect (OIDC) instead of long-lived credentials when possible. With OIDC, your pipeline requests short-lived tokens directly from cloud providers without storing any secrets:
permissions:
  id-token: write
  contents: read

steps:
  - name: Configure AWS credentials
    uses: aws-actions/configure-aws-credentials@v4
    with:
      role-to-assume: arn:aws:iam::123456789:role/github-deploy
      aws-region: us-east-1
No AWS access keys stored anywhere. The token is generated for each pipeline run and expires in minutes. This is significantly more secure than storing AWS_ACCESS_KEY_ID and AWS_SECRET_ACCESS_KEY as repository secrets.
CI/CD Interview Questions and What Senior JavaScript Candidates Are Expected to Know
I review interview feedback regularly through jsgurujobs.com, and CI/CD questions are appearing in almost every senior JavaScript interview cycle. Not as a separate DevOps round, but woven into system design and practical coding exercises.
The most common questions fall into three categories. First, "Walk me through how code gets from your local machine to production." This tests whether you understand the full pipeline or just push to main and hope. Second, "How would you handle a deployment that breaks production at 2am?" This tests rollback strategy and monitoring. Third, "How do you manage environment configuration across development, staging, and production?" This tests whether you understand the build-time vs runtime configuration problem.
For developers preparing for JavaScript system design interviews, CI/CD knowledge is often the differentiator. Two candidates might design the same architecture, but the one who explains how they would deploy it, test it in staging, canary it to 10% of users, and monitor error rates will always score higher.
Here is a real scenario question from a senior frontend interview in February 2026: "You are deploying a Next.js application that serves 50,000 users. Your latest deployment causes a 3x increase in Largest Contentful Paint for users on mobile. How does your pipeline detect this and what happens automatically?" The expected answer covers synthetic monitoring in CI, real user monitoring in production, performance budgets that fail the build, and automated rollback triggers. If you cannot answer this, you are not ready for senior roles in 2026.
What Mid-Level Developers Get Wrong About CI/CD in Interviews
The biggest mistake I see is describing CI/CD as a linear process. Push code, run tests, deploy. Done. Senior developers understand that CI/CD is a feedback loop. Production metrics feed back into the pipeline. Flaky tests get quarantined automatically. Deployment frequency data informs sprint planning. Build times are tracked and optimized like any other performance metric.
Another common mistake is not knowing the difference between CI and CD. They are not the same thing. CI is about integrating code frequently with automated validation. CD is about delivering that validated code to users. You can have CI without CD. You can have manual deployments triggered after CI passes. Understanding this distinction shows maturity.
The third mistake is treating the pipeline as someone else's code. In the interview, if you say "our DevOps team handles the pipeline," that is a red flag for a senior role. In 2026, the pipeline is your code. You should be able to write it, debug it, and improve it just like any other part of the application.
GitHub Actions vs GitLab CI vs Jenkins and Which CI/CD Platform JavaScript Teams Actually Choose in 2026
GitHub Actions dominates the JavaScript ecosystem. The integration with GitHub repositories is seamless, the marketplace has thousands of pre-built actions, and the free tier is generous enough for most small teams. For JavaScript developers, it is the default choice unless there is a specific reason to choose something else.
GitLab CI is the second most popular choice, especially for teams that are already on GitLab. Its pipeline syntax is more powerful than GitHub Actions for complex workflows, with features like dynamic child pipelines and directed acyclic graph scheduling. If your company uses GitLab, learn GitLab CI deeply.
Jenkins is still around. It powers CI/CD at some of the largest companies in the world. But for new JavaScript projects in 2026, Jenkins is rarely the right choice. The maintenance burden is high, the plugin ecosystem is fragile, and the UX is from a different era. If you encounter Jenkins in an interview or a new job, it is a sign that infrastructure modernization is needed, which is both a challenge and an opportunity.
CircleCI and Travis CI have faded significantly. CircleCI still has a loyal user base for specific use cases like complex Docker workflows, but GitHub Actions has absorbed most of their market share.
My recommendation for any JavaScript developer in 2026: learn GitHub Actions deeply. It covers 90% of use cases. If your company uses something else, the concepts transfer directly because every CI/CD platform does the same fundamental thing with different syntax.
Monorepo CI/CD Pipelines and Why They Break Differently Than Single-Project Pipelines
Monorepos are increasingly common in JavaScript development. A single repository containing a Next.js frontend, a Node.js API, a shared component library, and a set of utility packages. Turborepo and Nx are the dominant tools for managing these structures in 2026. But monorepo CI/CD introduces problems that single-project pipelines never encounter.
The fundamental issue is selective building. When someone changes a file in the shared component library, both the frontend and the API might need to rebuild and redeploy. But when someone changes only the API's route handler, rebuilding and redeploying the frontend wastes time and creates unnecessary risk.
Turborepo handles this with its dependency graph. It knows which packages depend on which, and only rebuilds what changed:
jobs:
  detect-changes:
    runs-on: ubuntu-latest
    outputs:
      frontend: ${{ steps.filter.outputs.frontend }}
      api: ${{ steps.filter.outputs.api }}
      shared: ${{ steps.filter.outputs.shared }}
    steps:
      - uses: actions/checkout@v4
      - uses: dorny/paths-filter@v3
        id: filter
        with:
          filters: |
            frontend:
              - 'apps/frontend/**'
              - 'packages/shared/**'
            api:
              - 'apps/api/**'
              - 'packages/shared/**'
            shared:
              - 'packages/shared/**'

  deploy-frontend:
    needs: detect-changes
    if: needs.detect-changes.outputs.frontend == 'true'
    runs-on: ubuntu-latest
    steps:
      - uses: actions/checkout@v4
      - run: npx turbo run build --filter=frontend
      - run: npx turbo run deploy --filter=frontend

  deploy-api:
    needs: detect-changes
    if: needs.detect-changes.outputs.api == 'true'
    runs-on: ubuntu-latest
    steps:
      - uses: actions/checkout@v4
      - run: npx turbo run build --filter=api
      - run: npx turbo run deploy --filter=api
The paths-filter action detects which directories changed. Notice that both frontend and api filters include packages/shared/**. A change to the shared package triggers both deployments, because both depend on it. A change to only apps/api/ triggers just the API deployment.
Without this selective approach, every commit triggers a full rebuild and deployment of everything. In a monorepo with 5 deployable applications, that means 5 deployments for a one-line change to a README file. Not only is this slow, it introduces unnecessary deployment risk. Every deployment has a non-zero chance of something going wrong. Deploying 5 applications when only 1 changed means 5x the risk for no benefit.
The other monorepo-specific problem is dependency versioning. When the shared component library updates, both the frontend and API need to be tested against the new version before either deploys. This creates a coordination problem that does not exist in separate repositories. The pipeline needs to test both consumers, verify both pass, and then deploy both in the correct order. If the API depends on new shared library types that the frontend also provides, deploying the API first might break the frontend temporarily.
Teams that handle this well use atomic deployments. Either all affected services deploy together, or none of them deploy. This is harder to implement but prevents the partial deployment states that cause the most confusing production bugs. The ones where the frontend expects an API response shape that the old API version does not provide.
Building Your First Production CI/CD Pipeline Step by Step
If you have read this far and still do not have a CI/CD pipeline on your project, here is what to do this week. Not next month. This week.
Start with the simplest possible pipeline. Create .github/workflows/ci.yml with three steps: install dependencies, run lint, run tests. That is it. Push it. Watch it run. Fix whatever breaks. This will probably take 20 minutes.
Then add type checking if you use TypeScript. Then add a build step. Then add caching. Then add deployment to a staging environment. Each addition takes 15-30 minutes and each one makes your project more professional and your workflow more reliable.
Do not try to build the perfect pipeline on day one. The teams with the best CI/CD practices got there iteratively. They started with lint and tests. They added deployment after a production outage reminded them why manual deployments are dangerous. They added canary deployments after a bad release affected all users simultaneously. Each improvement was motivated by a real problem.
The pipeline I described in this article took real teams months to evolve. But they all started with three steps in a YAML file. Start there.
One year from now, you will either be the developer who owns the deployment pipeline or the developer who waits for someone else to deploy their code. In 2026, with teams shrinking and expectations growing, there is no room for developers who treat their responsibility as ending at the pull request. The code that never reaches users might as well not exist. CI/CD is how you make sure your work actually matters.
If you want to stay ahead of infrastructure and deployment trends in the JavaScript ecosystem, I share production patterns and market insights weekly at jsgurujobs.com.
FAQ
Do I need to learn CI/CD if I am a frontend developer?
Yes. In 2026, the distinction between frontend and full-stack is blurring rapidly, especially at smaller companies. Even if you never configure a Docker container, understanding how your React or Next.js application gets from a pull request to production is expected at the senior level. Interviewers increasingly ask frontend candidates about deployment strategies, environment configuration, and monitoring.
How long does it take to set up a basic CI/CD pipeline for a JavaScript project?
A basic pipeline with linting, type checking, and tests takes about 20-30 minutes to set up with GitHub Actions. Adding staging deployment might take another hour. A full production pipeline with canary deployments, automated rollback, and monitoring takes days to weeks to evolve, but you should not build that all at once. Start simple and add complexity as your project needs it.
Should I use GitHub Actions or GitLab CI for my JavaScript project?
Use whatever your repository is hosted on. If your code is on GitHub, use GitHub Actions. If it is on GitLab, use GitLab CI. The concepts are identical and the syntax differences are minor. Switching between them takes a day, not a week. Do not overthink the platform choice.
What is the difference between CI and CD?
Continuous Integration is the practice of merging code frequently and validating each merge with automated tests. Continuous Deployment takes validated code and automatically delivers it to users. You can have CI without CD. Many teams run CI on every pull request but deploy manually once a week. Both are valuable, and CI is where you should start.
Share this article